



 Los Puquios, Argentina. Every ski winter from 1950 to 2025.
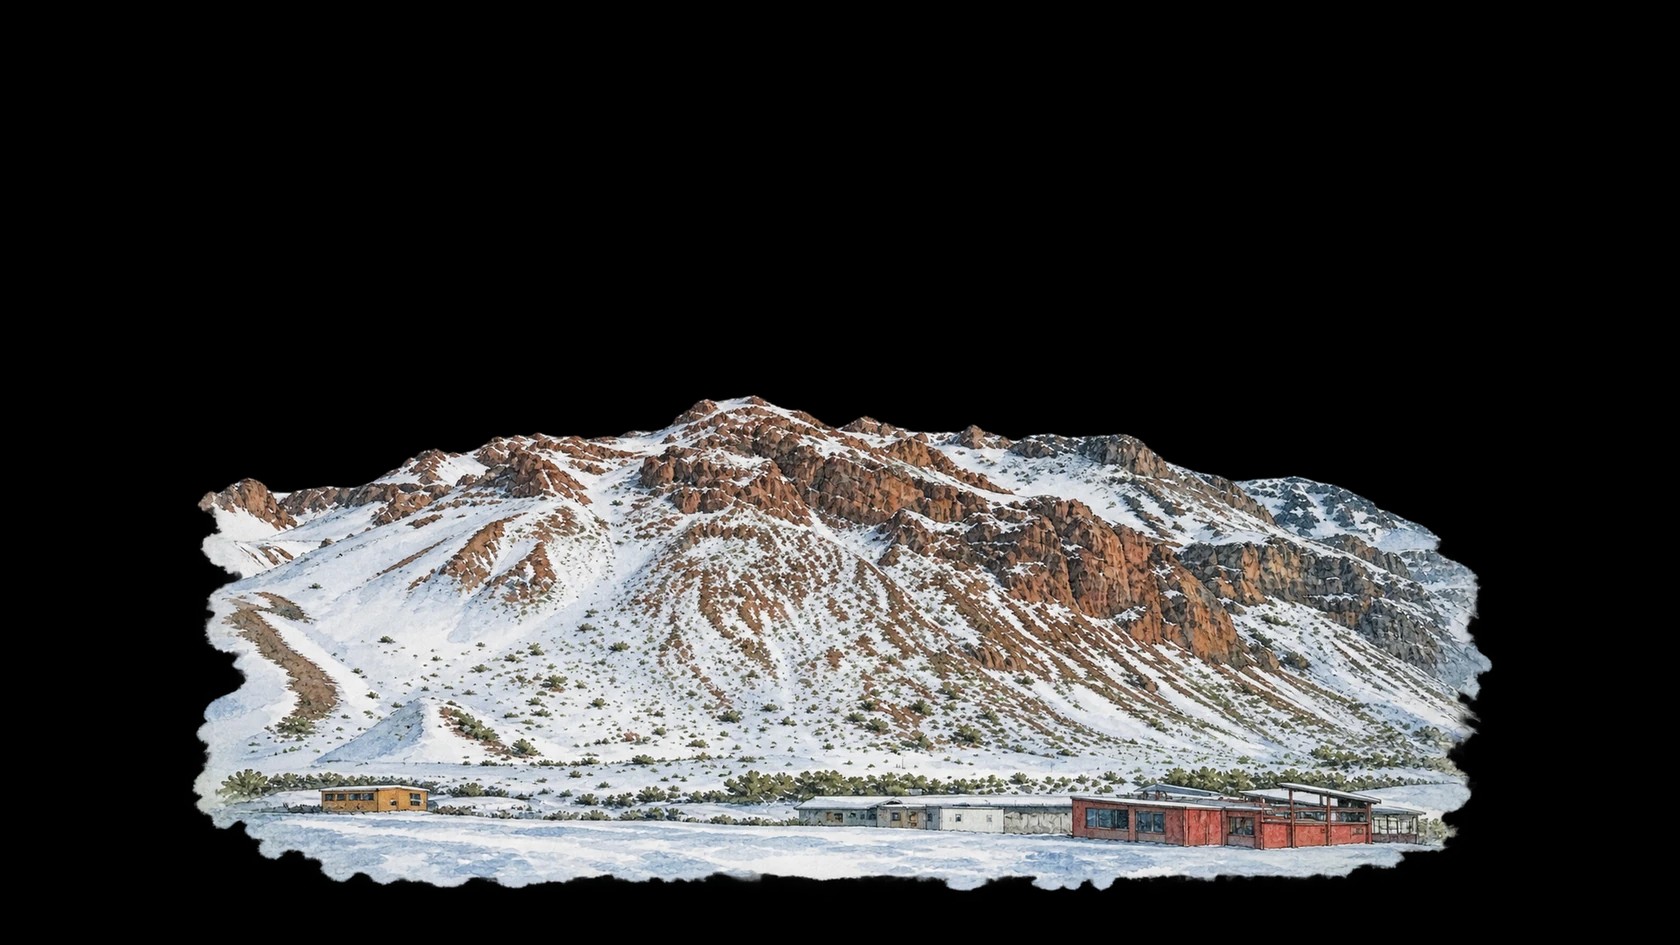

Every day of every winter
Each row is a winter, oldest at the top. Each column is a day, from the start of the season to the end. The darker the blue, the more snow fell that day.
Loading the daily snowfall…
Climate change
Average winter temperature at the summit
Faster warming than 5% of 736 resorts
+0.9°C+1.7°F
The trend: from -3°C26°F to -2°C28°F. Point at a winter to read it.
Snowfall at the summit
−4%
The trend: from 3.3 m129 in to 3.2 m124 in. Point at a winter to read it.
Powder days at the summit
−1 day
The trend: from 9 to 8. Point at a winter to read it.
Days with a base at the summit
±0 days
The trend: from 149 to 149. Point at a winter to read it.
Days with fresh snow at the summit
−1 day
The trend: from 40 to 39. Point at a winter to read it.
Each dot is one winter. The curve is a running average over about ten winters; the dotted line is the straight trend through all of them, and the changes above are measured along it. One winter is weather; the trend is climate.
Then and now
Then 1950–1979Now 1996–2025
- Snowfall at the summit+2%
Then
3.1 m121 in
Now
3.1 m123 in
- Snowfall in the village+1%
Then
2.8 m111 in
Now
2.8 m112 in
- Powder days at the summit±0 days
Then
9
Now
9
- Days with a base at the summit±0 days
Then
148
Now
148
- Average temperature at the summit+0.5°C+1.0°F
Then
-3°C27°F
Now
-2°C28°F
Averages per winter over the first and last 30 winters. A powder day brings 10 cm4 in or more of new snow; a base is 30 cm12 in or more on the ground.
Records
All winters
- 1950s19501.5 m60 in19513.5 m139 in19521.9 m75 in19533.2 m125 in19544.3 m170 in195588 cm35 in19563.3 m128 in19574.2 m166 in19582.5 m96 in19594.0 m157 in
- 1960s19603.5 m137 in19613.2 m126 in19623.6 m140 in19634.4 m172 in19642.2 m85 in19654.2 m166 in19662.7 m108 in19672.0 m77 in19681.4 m53 in19692.6 m104 in
- 1970s19701.7 m67 in19712.0 m77 in19725.1 m200 in19733.0 m120 in19742.8 m109 in19752.3 m92 in19763.2 m125 in19775.1 m202 in19785.7 m225 in19792.4 m94 in
- 1980s19802.5 m99 in19811.5 m58 in19828.5 m333 in19834.0 m159 in19846.4 m254 in19851.9 m76 in19863.0 m117 in19877.0 m276 in19882.1 m84 in19893.9 m152 in
- 1990s19902.4 m93 in19913.6 m143 in19923.3 m129 in19932.2 m85 in19942.6 m104 in19953.0 m120 in19961.4 m53 in19976.4 m251 in19981.2 m46 in19993.1 m120 in
- 2000s20004.8 m189 in20014.2 m166 in20024.4 m173 in20032.3 m89 in20042.5 m100 in20055.6 m220 in20065.3 m207 in20073.8 m150 in20083.7 m147 in20094.2 m167 in
- 2010s20101.9 m76 in20113.0 m117 in20122.0 m77 in20132.4 m96 in20142.5 m98 in20154.7 m183 in20162.8 m109 in20171.8 m69 in20182.5 m96 in20191.2 m46 in
- 2020s20202.9 m114 in20211.6 m62 in20222.3 m91 in20234.0 m157 in20243.4 m133 in20252.2 m85 in
Modelled weather from ERA5 and ERA5-Land, not measured on the slopes. Snow depth is the average over a grid cell about 9 km wide, so it can differ a lot from what the piste report says. How SnowOdds works