



 Centro Ski Pucón, Chile. Every ski winter from 1950 to 2025.
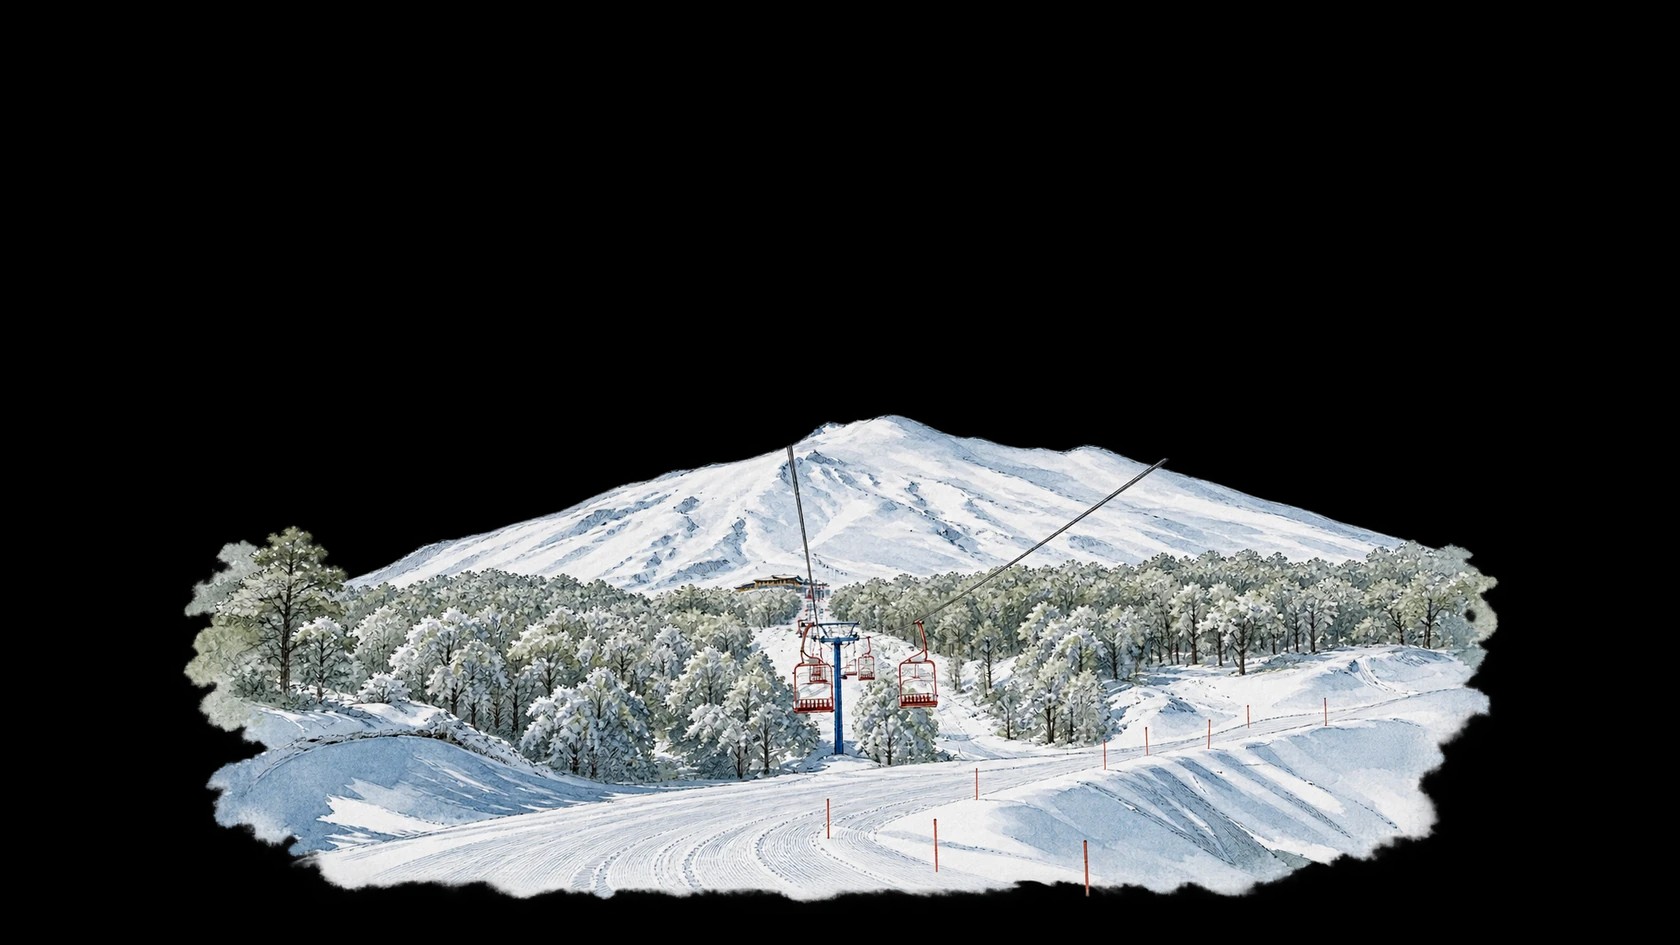

Every day of every winter
Each row is a winter, oldest at the top. Each column is a day, from the start of the season to the end. The darker the blue, the more snow fell that day.
Loading the daily snowfall…
Climate change
Average winter temperature at the summit
Faster warming than 2% of 736 resorts
+0.7°C+1.2°F
The trend: from 0°C32°F to 1°C33°F. Point at a winter to read it.
Snowfall at the summit
−4%
The trend: from 1.5 m61 in to 1.5 m58 in. Point at a winter to read it.
Powder days at the summit
−1 day
The trend: from 3 to 3. Point at a winter to read it.
Days with a base at the summit
±0 days
The trend: from 7 to 7. Point at a winter to read it.
Days with fresh snow at the summit
−1 day
The trend: from 33 to 33. Point at a winter to read it.
Each dot is one winter. The curve is a running average over about ten winters; the dotted line is the straight trend through all of them, and the changes above are measured along it. One winter is weather; the trend is climate.
Then and now
Then 1950–1979Now 1996–2025
- Snowfall at the summit−7%
Then
1.6 m63 in
Now
1.5 m59 in
- Snowfall in the village−3%
Then
1.1 m43 in
Now
1.0 m41 in
- Powder days at the summit−1 day
Then
4
Now
3
- Days with a base at the summit−1 day
Then
8
Now
7
- Average temperature at the summit+0.5°C+0.9°F
Then
0°C32°F
Now
1°C33°F
Averages per winter over the first and last 30 winters. A powder day brings 10 cm4 in or more of new snow; a base is 30 cm12 in or more on the ground.
Records
All winters
- 1950s19502.0 m78 in195188 cm35 in195275 cm30 in19531.3 m50 in19542.5 m96 in19551.3 m51 in19561.6 m64 in19572.0 m78 in195880 cm31 in19591.7 m65 in
- 1960s19601.6 m63 in19612.2 m88 in196275 cm30 in19631.4 m54 in19642.1 m81 in19651.5 m59 in19661.6 m63 in19672.6 m104 in196862 cm24 in19692.0 m80 in
- 1970s19702.1 m81 in19712.0 m78 in19721.4 m56 in19731.8 m70 in19742.0 m79 in19751.9 m75 in19761.5 m59 in19772.6 m102 in19781.1 m41 in197985 cm33 in
- 1980s19801.2 m47 in198197 cm38 in19821.5 m58 in19832.1 m82 in19842.2 m85 in198542 cm17 in198661 cm24 in198783 cm33 in19881.7 m68 in19891.4 m56 in
- 1990s199066 cm26 in19911.2 m45 in19921.5 m59 in19931.2 m48 in19941.1 m42 in19953.1 m122 in199675 cm30 in19971.4 m56 in199875 cm30 in19991.4 m54 in
- 2000s20001.7 m65 in20011.4 m55 in20021.4 m57 in200388 cm35 in20041.1 m43 in20051.3 m49 in20061.8 m70 in20074.2 m167 in20081.2 m49 in20091.5 m57 in
- 2010s20102.1 m81 in20112.0 m80 in20121.1 m43 in201381 cm32 in20141.9 m73 in20151.7 m65 in201668 cm27 in20172.2 m85 in20181.4 m55 in20191.7 m68 in
- 2020s20201.9 m76 in202199 cm39 in20222.5 m97 in20231.3 m50 in20241.2 m45 in202594 cm37 in
Modelled weather from ERA5 and ERA5-Land, not measured on the slopes. Snow depth is the average over a grid cell about 9 km wide, so it can differ a lot from what the piste report says. How SnowOdds works